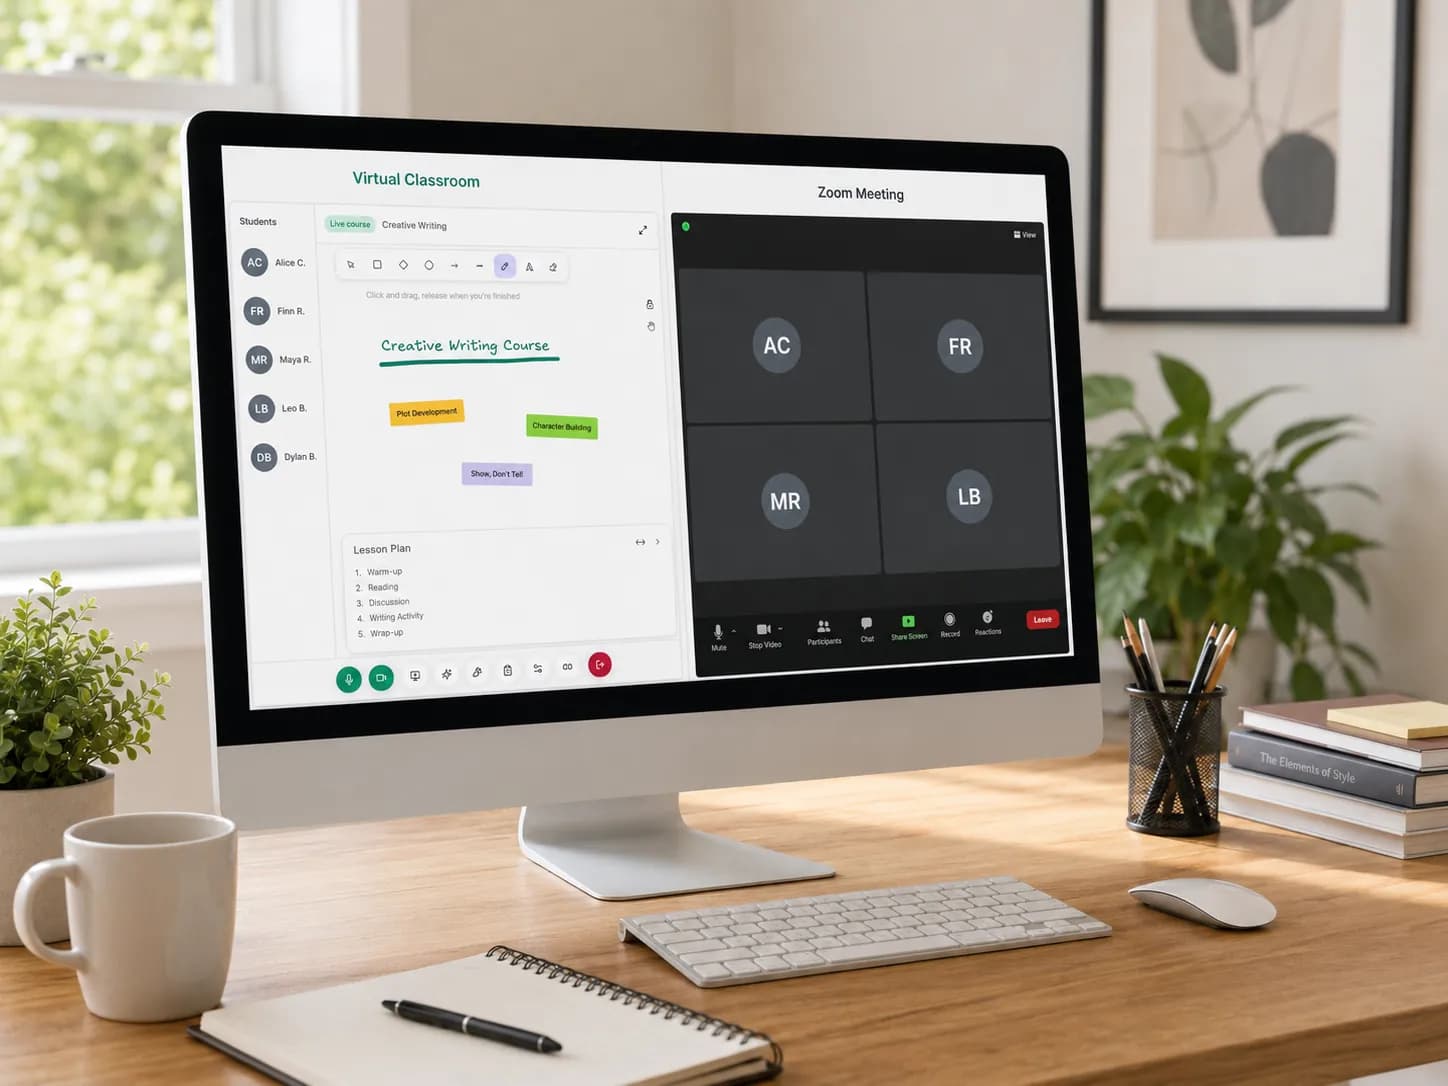
An online maths lesson reaches an important moment when you stop writing and ask the student to take over. Can they choose the next step? Can you see their working? If they make a mistake, can you find out why?
Quick answer: To teach maths online, prepare a clear learning objective, check the student's starting knowledge, model a worked example, and give them a related problem to solve. Use a shared whiteboard to make the working visible, then finish with an independent question that tells you what to teach next.
This guide follows a complete 45-minute lesson on straight-line graphs, suitable for a student working on KS3 or GCSE foundations who already understands coordinates and simple substitution. It includes the questions to ask, the answers to check, and the decisions to make when the student struggles.
It also shows where Teamlilit's maths tutoring software fits into the lesson: write an equation, plot a function, and let the student work on the same board.
What you need to teach maths online
Set up a reliable way to speak with the student and see their mathematical work. A laptop or desktop gives you room for the question, the working and the graph. Check what the student will use too: something readable on your monitor may be cramped on their phone.
Prepare:
- Clear audio and a stable internet connection.
- A shared writing surface, or a way for the student to show paper working.
- An equation editor for readable mathematical notation.
- A graphing tool when the topic needs one.
- A short sequence of questions, with the answers checked beforehand.
- Paper and a pen as a practical fallback.
A pen tablet can make handwriting easier, but this lesson can be taught using typed equations, plotted graphs and paper. Test your setup before buying extra equipment.
In Teamlilit, the interactive classroom whiteboard includes an equation editor, function graphing and multiple board tabs inside the live lesson, and a Desmos calculator can be embedded on the board if you prefer it. You can prepare your examples on the lesson's boards before the student arrives.
Check participation before you start. Students work on the board when you bring them on stage. A guest who joins without an account can watch and follow the board, but needs to create an account and be invited on stage to participate. If you are still choosing where to teach, a virtual classroom for tutors keeps the video, the board and the student's lesson history together, which is the setup this guide assumes.
Start with one thing the student should learn
"Practise graphs" is too broad to guide your decisions. For this lesson, use:
By the end, the student should be able to connect the equation y = mx + c with its straight-line graph, explain the gradient and y-intercept, and check a point by substitution.
The lesson focuses on what the equation tells us. It assumes the student has already met coordinates and can calculate expressions such as 2 × 3 + 1.
If those foundations are insecure, spend the lesson repairing them. The timetable below is a suggested structure, not a deadline for finishing the topic. And if the same slips keep coming back lesson after lesson, our guide to supporting students with maths learning difficulties covers page layout, pacing and record-keeping.
The Education Endowment Foundation's review of the evidence on remote learning found that the quality of teaching matters more than how a lesson is delivered, singling out clear explanations that build on prior learning, scaffolding and feedback, and that supporting pupils to work independently can improve outcomes. A useful online lesson plan makes space for all three.
A 45-minute online maths lesson plan
| Time | Activity | Evidence to look for |
|---|---|---|
| 0 to 5 minutes | Check substitution and coordinates | Can the student calculate and locate a point? |
| 5 to 13 minutes | Model y = 2x + 1 | Can they connect a calculation to a point? |
| 13 to 20 minutes | Compare related graphs | Can they distinguish gradient from y-intercept? |
| 20 to 29 minutes | Complete guided practice | Can they explain and carry out the method? |
| 29 to 39 minutes | Attempt independent questions | Can they apply the ideas without prompts? |
| 39 to 45 minutes | Use an exit question and set practice | What is secure, and what needs revisiting? |
Before the session, prepare three whiteboard tabs: Example, Your turn and Check. Keep answers away from the area you are showing the student until they have attempted the question. The questions for all three boards are below, ready to paste in; the answers stay in this article.
Board 1: Example
1. If x = 3, what is 2x + 1?
2. On coordinate axes, where would you place the point (0, 1)?
3. If x increases from 1 to 2 in y = 2x + 1, what happens to y?
Worked example: y = 2x + 1, with a table of values for x = −1, 0, 1 and 2.
Compare: y = 2x + 3, then y = 3x + 1.
Board 2: Your turn
y = 3x − 2
1. Find y when x = 0, 1 and 2.
2. Write the three coordinate pairs.
3. Predict the y-intercept and gradient.
4. Plot the function and compare it with your prediction.
5. Explain why (2, 4) lies on the line.
Board 3: Check
1. For y = 4x − 3, state the gradient and y-intercept. Does (2, 5) lie on the line?
2. Write the equation of a line with gradient 2 and y-intercept −4. Give two points on it.
3. A student says y = 2x + 5 is steeper than y = 2x + 1 because 5 is bigger than 1. Explain the mistake.
Exit question: for y = 5x + 2, explain the meaning of 5 and 2. Is (2, 12) on the line? Show how you know.
Minutes 0 to 5: check the starting point
Put these three questions on the board:
- If x = 3, what is 2x + 1?
- On coordinate axes, where would you place the point (0, 1)?
- If x increases from 1 to 2 in y = 2x + 1, what happens to y?
The answers are 7; on the y-axis, one unit above the origin; and y increases from 3 to 5, a change of 2.
Ask the student to show how they obtained each answer. A correct number alone does not tell you whether they understand substitution or guessed successfully.
If they calculate 2 × 3 + 1 as 9, revisit the order of operations. If they place (0, 1) on the x-axis, practise reading coordinates before adding several lines to a graph.
A useful response is: "Show me what the first number in that coordinate tells you to do." It gives you more information than asking whether they understand coordinates. If this is your first lesson with a new student, these five minutes double as a diagnostic, which is the approach we set out in how to run a tutoring trial lesson.
Minutes 5 to 13: model one worked example
Write y = 2x + 1 and calculate a small table of values.
| x | Substitution | y | Coordinate |
|---|---|---|---|
| −1 | 2 × (−1) + 1 | −1 | (−1, −1) |
| 0 | 2 × 0 + 1 | 1 | (0, 1) |
| 1 | 2 × 1 + 1 | 3 | (1, 3) |
| 2 | 2 × 2 + 1 | 5 | (2, 5) |
Work through the first two rows slowly. Explain how the chosen x-value produces a y-value, and how those values become a coordinate pair. Invite the student to finish the remaining rows with support.
Before displaying the graph, ask: "Which point should be on the y-axis? How do you know?"
The important connection is that x = 0 everywhere on the y-axis. Substituting zero gives y = 1, so this line crosses the y-axis at (0, 1).
In Teamlilit, open the maths field with the sigma button (Σ) and type the function. Select the formula and press Plot to open it in the graphing tool. Set an x-range that includes your calculated points, then match each coordinate to the line. The formula stays editable afterwards: select it and press the sigma button again to change it.
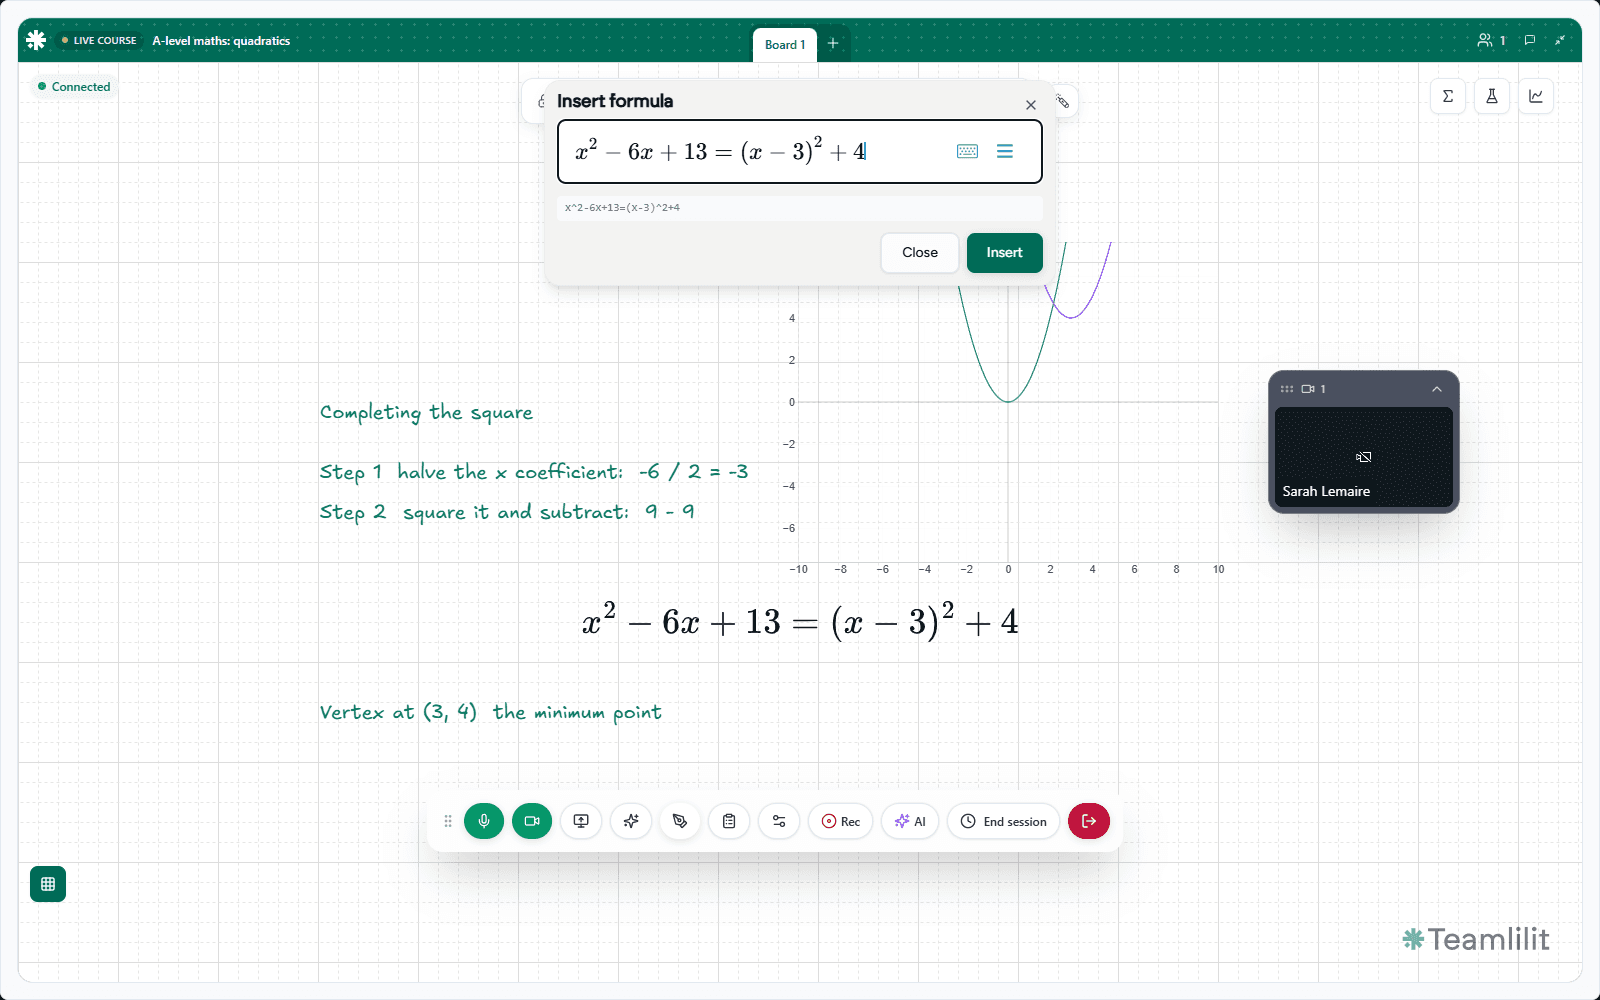
Annotate a movement from (0, 1) to (1, 3): one unit to the right and two units up. Connect this to a gradient of 2. Explain that gradient is the change in y divided by the change in x; the one-unit movement makes that ratio easy to see here.
Ask: "Would moving two units to the right change the gradient?" The rise would be four, but 4 ÷ 2 still gives 2.
The EEF's guidance on using worked examples explains how a completed solution can help pupils concentrate on the reasoning and strategy rather than the procedure. Leave your worked example visible long enough to discuss why its steps make sense.
Minutes 13 to 20: predict before plotting
Keep y = 2x + 1 and introduce y = 2x + 3.
Before revealing the second graph, ask:
- "What stayed the same in the equation?"
- "What changed?"
- "Where will the new line cross the y-axis?"
- "Will the lines meet?"
Both lines have gradient 2. Their y-intercepts are 1 and 3, so they are distinct parallel lines. At any given x-value, the second line's y-value is two greater.
Next compare y = 2x + 1 with y = 3x + 1. Ask the student to predict what changes this time. Both pass through (0, 1), while the second has a greater gradient.
Teamlilit can plot several functions on the same axes, each in its own colour. Label the equations as well, so the comparison does not depend on colour alone.
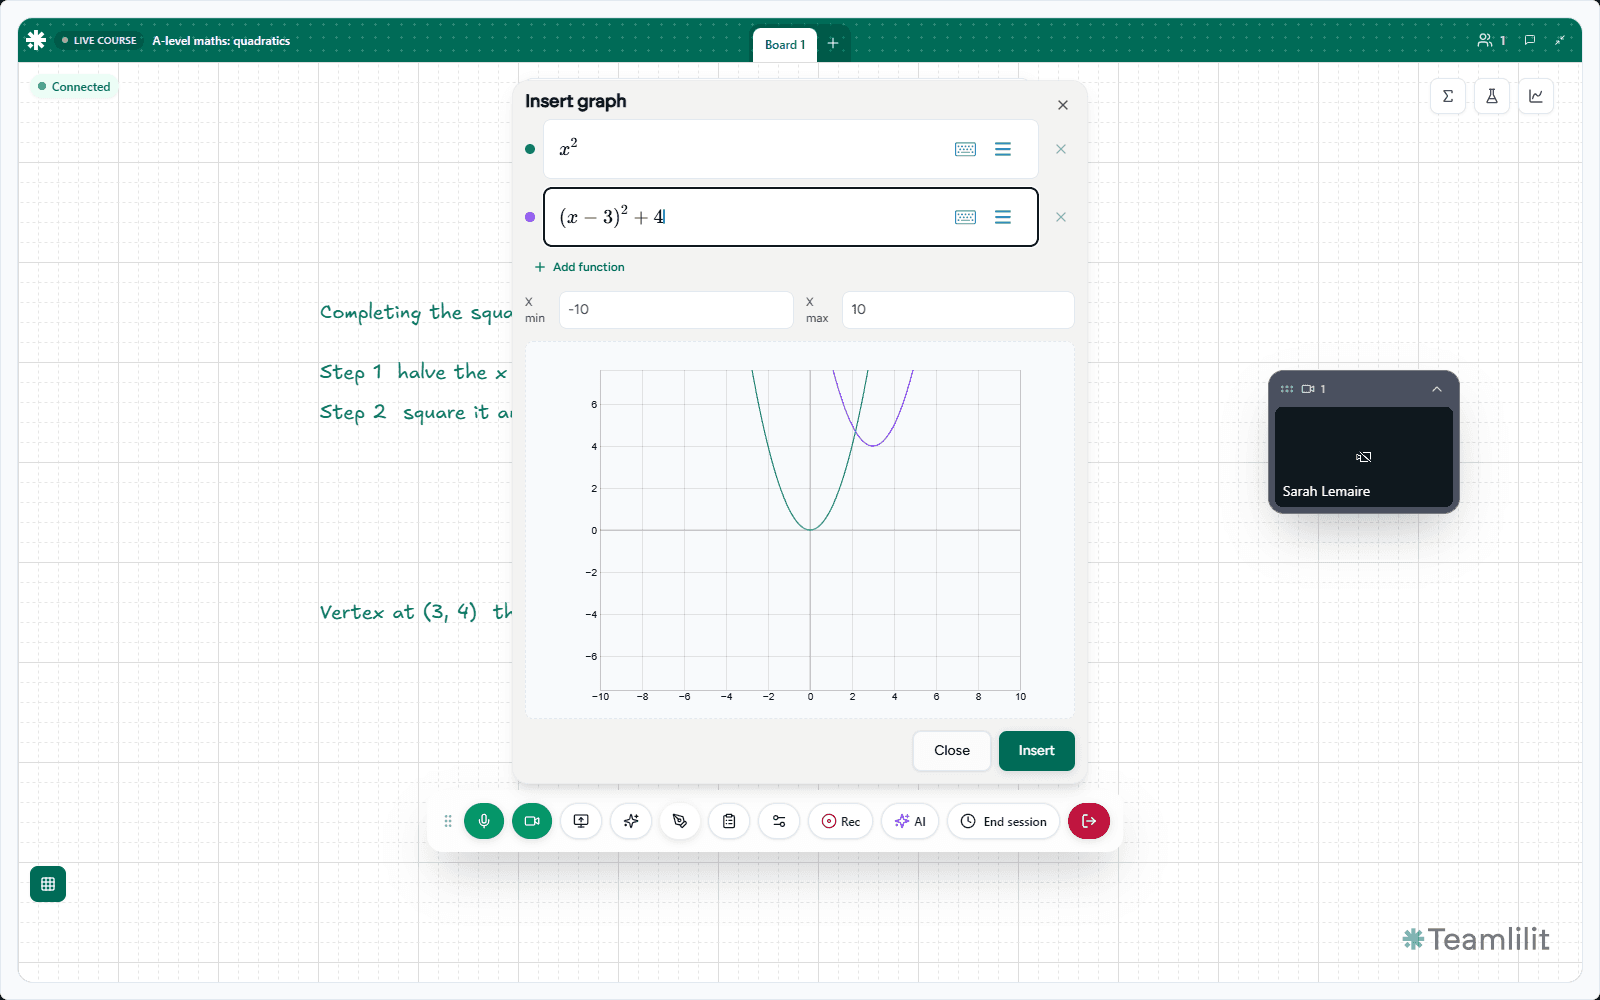
The purpose of plotting is to check a mathematical prediction. Give the student time to commit to an explanation before the graph appears.
This focus on connecting algebraic and graphical representations fits the NCETM guidance on graphical representations, which expects students to recognise the intercept and the rate of change both in the written algebraic form and in the graph.
Minutes 20 to 29: give the student the working
Move to the Your turn board and introduce y = 3x − 2.
Ask the student to:
- Find y when x = 0, 1 and 2.
- Write the three coordinate pairs.
- Predict the y-intercept and gradient.
- Plot the function and compare it with their prediction.
- Explain why (2, 4) lies on the line.
The coordinates are (0, −2), (1, 1) and (2, 4). The gradient is 3, and the y-intercept is −2. Substituting x = 2 gives y = 3 × 2 − 2 = 4.
Bring the student on stage so they can enter their own formula, draw and plot. Give them time to act before supplying the next step.
If they get stuck, start with a small prompt: "Which value of x makes it easiest to find the y-intercept?" If that is not enough, return to your earlier substitution example and model another step.
Respond to the specific mistake
| What the student does | What to ask or show |
|---|---|
| Says the y-intercept is 3 | Ask them to substitute x = 0 and locate the resulting point. |
| Calculates 3 × 0 − 2 as 2 | Keep the subtraction sign visible and work through 0 − 2. |
| Writes (4, 2) instead of (2, 4) | Ask which number was the input and which was the output. |
| Calls the gradient "how high the line is" | Compare the two parallel lines and mark the same horizontal and vertical changes on each. |
| Accepts the plotted line without checking | Ask them to test one coordinate against the equation. |
Be precise in your feedback. "You substituted correctly; now check the sign of the final term" tells the student where to look. The EEF's discussion of feedback in maths favours feedback that moves learning forward, aimed at the task in front of the student and their next step rather than a verdict on how they did.
The harder decision is how much help to give. Too little and the lesson stalls; too much and you have solved the question for them.
Minutes 29 to 39: check independent understanding
Switch away from the worked solution to the Check board and give the student these questions. Ask for reasoning before using the graphing tool to check.
Question 1: For y = 4x − 3, state the gradient and y-intercept. Does (2, 5) lie on the line?
Question 2: Write the equation of a line with gradient 2 and y-intercept −4. Give two points on it.
Question 3: A student says y = 2x + 5 is steeper than y = 2x + 1 because 5 is bigger than 1. Explain the mistake.
These questions ask the student to interpret an equation, construct one, and evaluate an explanation. If time is short, select the question that best checks the difficulty you noticed earlier.
If the student finishes comfortably, extend to y = −2x + 1 and ask what the negative gradient means. As x increases by one, y decreases by two. Use this as an extension only when the earlier ideas are secure.
Minutes 39 to 45: finish with evidence and a next step
For the final check, give a fresh equation:
For y = 5x + 2, explain the meaning of 5 and 2. Is (2, 12) on the line? Show how you know.
The gradient is 5 and the y-intercept is 2. The point satisfies the equation because 5 × 2 + 2 = 12.
Note whether the student answers independently, needs a prompt, or still confuses the two coefficients. This gives the next lesson a starting point.
Set a small practice task matched to the result. For example, ask them to find the gradient and y-intercept of y = 3x + 4 and y = 3x − 1, then explain how the graphs compare. The gradients are both 3, the intercepts are 4 and −1, and the lines are parallel.
A useful lesson note might read:
Teamlilit saves the whiteboards with the session, so you can reopen the actual working rather than a memory of it. Use that alongside a short note; our free tutoring lesson notes template gives you a starting structure, and lesson notes software keeps each note attached to the student and the session it came from. For what else is worth recording beyond the lesson itself, see what student records private tutors should keep.
Adapt the method to other maths topics
The timing will change, but the sequence carries across topics: check a prerequisite, explain an example, let the student attempt a related task, and use their response to choose the next step.
Fractions and primary maths
Start with a representation the child can explain. For 1/2 + 1/4, draw two equal-sized bars, partition both into quarters, and connect the shading to 2/4 + 1/4 = 3/4. Ask why the wholes must be the same size. Younger learners may need a shorter session and help handling materials.
Solving equations
For 3x + 5 = 20, show subtracting 5 from both sides, then dividing both sides by 3. Check x = 5 in the original equation. Give a related question and ask the student to explain how each operation keeps both sides equal.
GCSE exam practice
Use a question appropriate to the student's exam board and tier. Ask them to identify the required method, complete the working, and then compare it with the relevant mark scheme. In Teamlilit, a past-paper PDF can sit in its own classroom tab alongside the working board. File tabs are for viewing rather than drawing, so to mark up a question, place it on the canvas as an image. A paper already stored in your Teamlilit library goes onto a tab without using extra storage. For students preparing outside school, our guide to tutoring homeschooled GCSE students covers mock dates and past-paper planning.
Small groups
Give everyone thinking time before one student explains a solution. Ask the others to prepare their own answer on paper, then invite different students to justify a step or challenge an error. One confident speaker's answer is not evidence that the whole group understands.
In a Teamlilit group lesson, up to three students can be on stage at once, so the students explaining a step can write on the board while the others follow. Group lessons run on the Pro and Academy plans; see how group tutoring software handles classes, or our guide to managing group tutoring sessions online.
The questions that make working visible carry across every topic too.
Common questions about teaching maths online
Can I teach maths online without a pen tablet?
Yes. An equation editor, typed text, graphing tools and paper working can support a complete lesson. A tablet may be useful if you frequently handwrite long solutions or draw diagrams. Try your existing setup with a student first.
How do I see the student's working in an online maths lesson?
Let them write on the shared board, or ask them to show paper working clearly. Teamlilit also lets you place a photograph of handwritten work on the canvas and annotate it. Ask about the reasoning behind a step as well as checking the written answer.
What should an online maths whiteboard include?
Look for readable equations, student participation, space for worked solutions, and a way to retain the lesson's work. Function plotting is particularly useful for algebra and graphs. Test whether both of you can comfortably read and operate the board on your actual devices.
What if the connection becomes unreliable during an online maths lesson?
Have the practice questions available before the lesson and agree how the student will share paper answers if the live board becomes difficult to use. If audio still works, continue with one clearly identified question at a time. Resume interactive graphing when the connection allows it.
How can I tell whether the student has understood?
Give a fresh question with the same underlying idea and ask for an explanation without walking them through it. Recheck in a later lesson too. An immediate correct response is useful evidence, but it does not establish that the learning will last.
Teach your next maths lesson in Teamlilit
Prepare one worked example, one student task and one final check. Teamlilit brings editable equations, function graphs and student writing into the lesson's shared whiteboard, with the boards saved for your next session.
Start with the walkthrough above and adapt it to what your student shows you.
The walkthrough and practice questions are original examples prepared for this guide. The educational sources below inform the teaching approach; they do not evaluate or endorse Teamlilit or this particular lesson plan.
Sources
- Remote Learning: Rapid Evidence Assessment - Education Endowment Foundation, 2020. Drawing on 60 systematic reviews and meta-analyses, it finds that teaching quality matters more than how lessons are delivered, and that supporting pupils to work independently can improve learning outcomes.
- Using worked examples to support mathematical problem-solving - Education Endowment Foundation, 2022. Worked examples present the problem and solution together, reducing cognitive load so pupils can focus on the reasoning and strategies involved.
- Integrating evidence into mathematics teaching: focus on feedback - Education Endowment Foundation, 2021. Applies the EEF feedback guidance to maths: high-quality initial instruction and formative assessment first, then feedback that moves learning forward.
- 4.2 Graphical representations - NCETM, Key Stage 3 mastery professional development guidance. Students should recognise the intercept and the gradient of a linear relationship both in its written algebraic form and in its graphical representation.
Explore Teamlilit for maths tutors or start a 14-day free trial. No credit card required.