

Teach maths on a board that speaks maths
Write a real equation, plot it on the same canvas, and hand the pen to your student. No photographing worksheets, no screen sharing a calculator app you both squint at.


Click the tabs: this is the real board chrome
Generic whiteboards were never built for algebra
- You type x squared as x^2 and hope the student reads it the way you meant it.
- Sketching axes by hand costs three minutes of the lesson, every time a graph comes up.
- The clean version of a worked solution lives on your paper pad, where the student cannot see it.
- A student who wants to try the next step has to describe it out loud instead of writing it.
Maths is written, not narrated. The board you teach on should hold the notation you actually use, and let the student write in it too.
Write the equation, then plot it without leaving the board
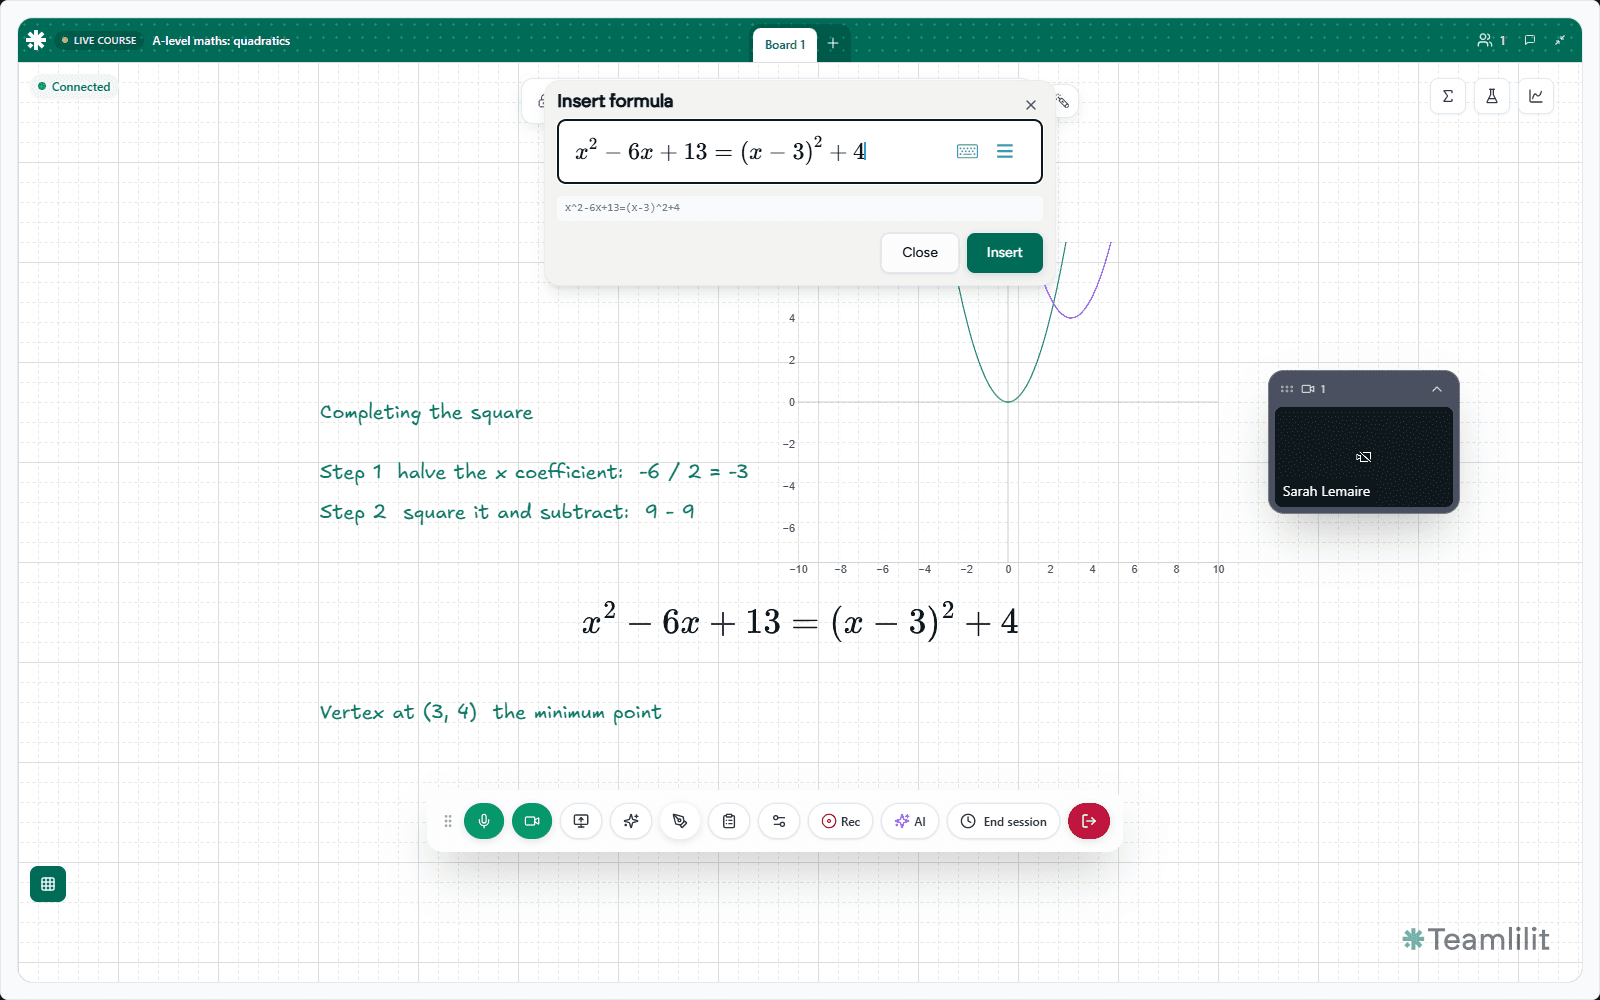
The sigma button opens a proper maths field that typesets as you type. Select a formula you have already written, press Plot, and it becomes a graph on the same canvas.
Formulas and graphs both stay editable. Select one later, reopen it, change a coefficient, and the board updates. Nothing is flattened into a picture you have to redraw.
What the board gives a maths teacher
A real equation editor
A maths field that typesets as you type: fractions, indices, roots, matrices and the rest. It lands on the board as proper notation, not as plain text approximating it.
Function graphing
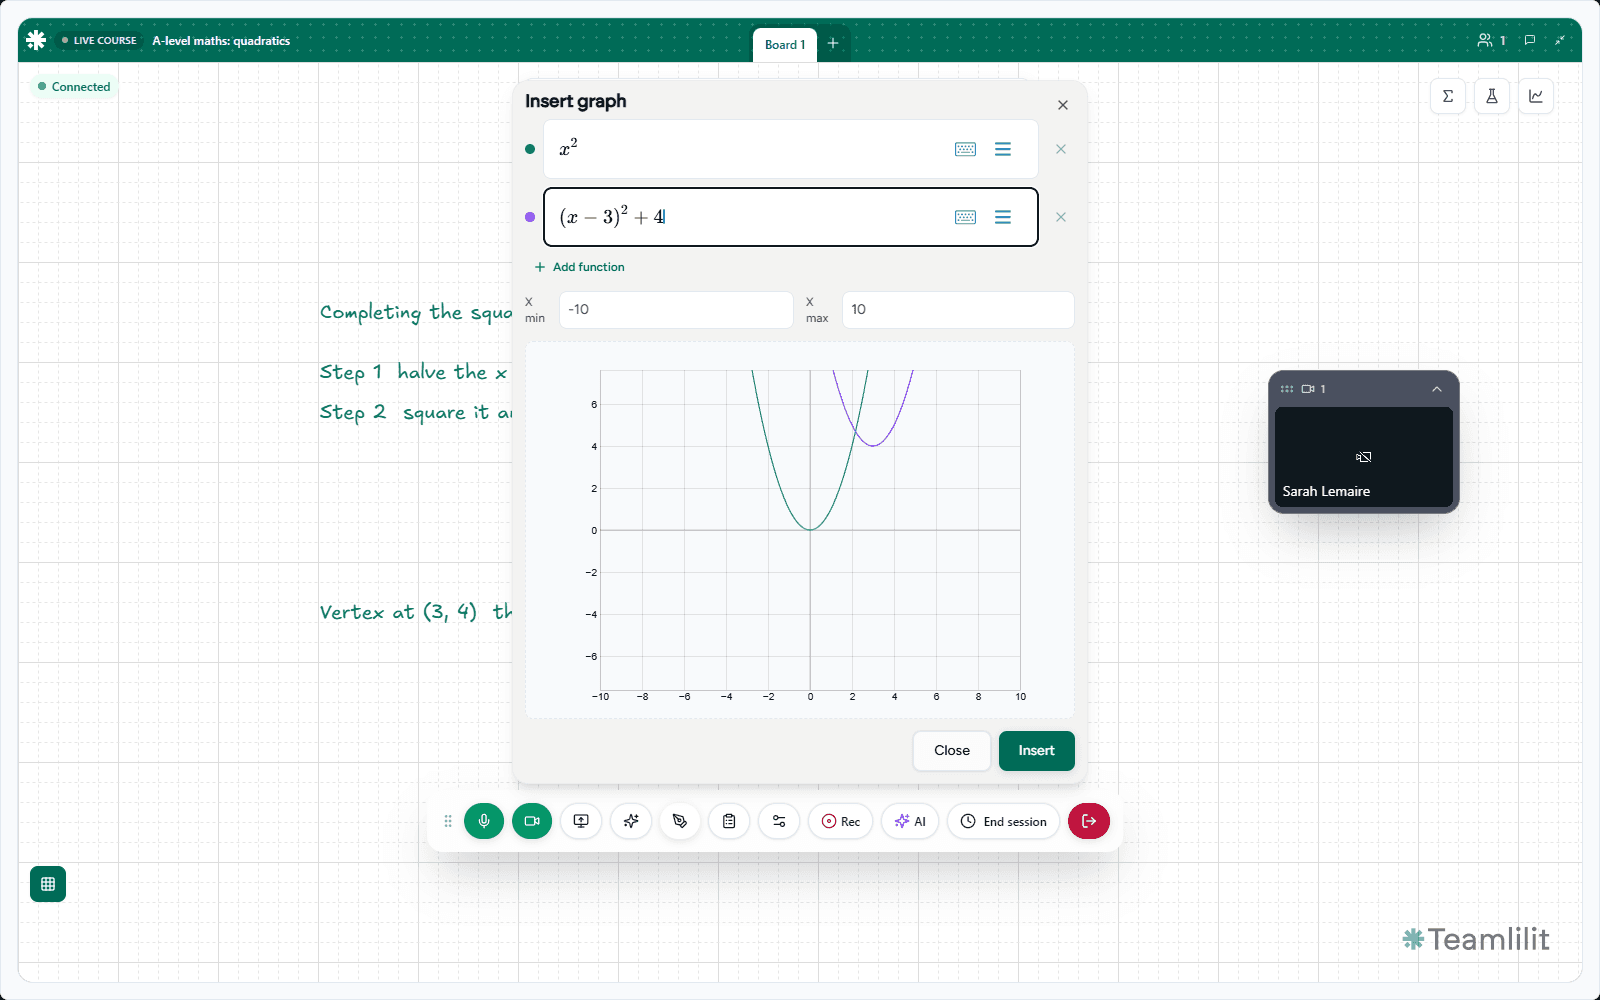
Plot several functions on one set of axes, each in its own colour, across the x range you choose. Built for comparing transformations side by side.
Formula to graph in one click
Select a formula already on the board and press Plot. The expression becomes a graph in place, so a definition and its shape sit next to each other.
On-screen symbol keyboard
A draggable maths keyboard for the symbols no laptop has. Move it anywhere on the board so it never covers the work you are pointing at.
Graph paper when you need it
Toggle a grid behind the canvas for axes, transformations and anything that wants squares. It is a per-person view setting, so a student can turn it on for themselves.
Students write on the board
Bring a student on stage and they can draw, insert formulas and plot graphs themselves. You decide who has the pen and when.
Desmos on the canvas
Embed the Desmos calculator, scientific, geometry or 3D tools directly on the board when the lesson wants a live graphing sandbox.
Photograph the working
Drop a photo of handwritten work onto the canvas and mark it up with the normal drawing tools, so a paper method gets the same treatment as anything you write.
A board per topic, prepared early
A session holds as many boards as you need. Set them up before the lesson so the first minute is teaching, not drawing axes.
The board in a real lesson
Captures from the live session board.
How a maths lesson runs on it
Prepare the boards
Open the session before the lesson and set up a board per topic: the worked example, the practice set, and the graph you want to build towards.
Teach in the notation
Write equations in the maths field, plot them, annotate them. Bring the student on stage when it is their turn to try one.
Keep it with the lesson
Boards, formulas and graphs save with the session, so the next lesson opens where this one stopped and the record sits on the student profile.
Half my old lesson time went on drawing axes and typing x^2 into a chat box. Writing the equation and plotting it on the same board took that friction out completely.
Beta user
A-level maths tutor
A generic whiteboard against a board that knows maths
Generic whiteboard
Teamlilit
Equations typed as plain text and read out loud
Typeset equations on the board, written the way the textbook writes them
Axes drawn by hand, badly, every single time
Graphs plotted from the expression, several to a set of axes
A formula and its graph live in two different apps
Select the formula, press Plot, and the graph appears beside it
Only the tutor can write, so the student describes their step
Bring the student on stage and they write, plot and draw themselves
The board is wiped and the working is gone
Boards save with the session and reopen next lesson
Teach more than maths?
The same board handles the sciences, and the rest of the platform handles the admin.
Put the maths on the board
Start a 14-day free trial and run your next lesson on a board that can hold an equation.
14-day free trial. No credit card required. Cancel anytime.
